Read My Boarding Pass App

In the previous blog post I discussed the underlying standards of the BCBP (Bar Coded Boarding Pass) following IATA Reso 792. Today I will built an Android mobile app that scans the PDF417 barcode and shows the raw content as well the decoded fields.

The are 3 main challenges for building the app, scanning/reading the barcode and decoding the text to individual attributes and as last, not to use any internet connection (to assure the user the users privacy and avoid any potential identity theft discussions)

As we build a native Android app we can rely on third party libraries to scan and decode barcodes. There is a number of commercial libraries in the market, but as I build a free app I will use the zxing-android-embedded library, which is a port of the ZXing (“Zebra Crossing”) barcode scanning library for Android with added embedding features, ZXing only provides the decoding logic. Both are licensed under Apache 2.0, ZXing can decode all the common types, such as EAN-8, EAN-13, UPC, ITF, PDF417, QRCode, Aztec, Data Matrix and a few more.

Integration Barcode Library ZXing

With the library the integration becomes as simple as adding a few lines of code only.

Add the dependency to the build gradle file

dependencies {
    compile fileTree(dir: 'libs', include: ['*.jar'])
    androidTestCompile('com.android.support.test.espresso:espresso-core:2.2.2', {
        exclude group: 'com.android.support', module: 'support-annotations'
    })
    compile 'com.android.support:appcompat-v7:25.3.1'
    compile 'com.android.support.constraint:constraint-layout:1.0.2'
    testCompile 'junit:junit:4.12'

    compile 'com.journeyapps:zxing-android-embedded:3.5.0'
}

Trigger the scan and read the result

public void scanCode(View view){
        new IntentIntegrator(this).initiateScan();
    }

    @Override
    protected void onActivityResult(int requestCode, int resultCode, Intent data) {
        IntentResult result = IntentIntegrator.parseActivityResult(requestCode, resultCode, data);
        if(result != null) {
            if(result.getContents() == null) {
                System.out.println("Scan failed or cancelled.");
            } else {
                System.out.println(result.getContents());
            }
        } else {
            super.onActivityResult(requestCode, resultCode, data);
        }
    }

For now, the app (“ReadMyBoP – Read My Boarding Pass”) does nothing but scan the barcode, identify if it is a valid boarding pass barcode, display the raw content and makes the content more human-readable. You can download from Google Playstore. It works with Android 4.1 and above.
There is one extra feature for now, it decodes the IATA fare codes (First, business, economy classes and the various discounted codes, it follows IATA Reso 728 if you want to look for the complete codeset.

Decoding the Raw Text

Given the fact, this is a fixed-length field text, it is no big deal to split the relevant info by substring’ing it using the decoding table that we started in the previous post. As basic validation we can use the mandatory “M” on position 1 and a length of not less than 59 characters (mandatory fields).

# Element Mandatory Size Sample Remark
1 Format Code M 1 M Always “M”
2 Number of legs encoded M 1
3 Passenger Name M 20
4 Electronic Ticket Indicator M 2 E
5 Operating carrier PNR Code M 7
6 Origin IATA Code M 3 FRA Airport Code
7 Destination IATA Code M 3 SIN Airport Code
8 Operating carrier IATA Code M 3 LH Airline
9 Flight Number M 5 3456
10 Date of Flight M 3 280 Julian Date
11 Compartment Code M 1 B First, Business, Economy
12 Seat Number M 4 25A
13 Check-in Sequence Number M 5 0012
14 Passenger Status M 1 00
15 Size of optional Block M 2 5D hexadecimal
16 Start Version Number 1 > Always “>”
17 Version Number 1 5
18 Field Size of follow ing structured message 2
19 Passenger Description 1
20 Source of check-in 1
21 Source of Boarding Pass Issuance 1
22 Date of Issue of Boarding Pass (Julian Date) 4
23 Document Type 1
24 Airline Designator of boarding pass issuer 3
25 Baggage Tag Licence Plate Number 1 13
26 Baggage Tag Licence Plate Number 2 13
27 Baggage Tag Licence Plate Number 3 13
28 Field Size of follow ing structured message 2
29 Airline Numeric Code 3
30 Document Form/Serial Number 10

Is there a roadmap ? For sure, if I find the time I will add the optional fields, an airline and airport code dictionary (must check the size of a local sqllite db if we want to stay offline). Maybe add baggage tag reader feature and local barcode image storage for boarding. Stay tuned !

readmybop1.2

Application Disclaimer: The application is for educational and research purpose. It is provided as-is, no warranty included. It does not transmit data over the internet and does not store any data upon exiting the app.

What’s in my boarding pass barcode ?

Since more than 10 years passengers are used to the barcode imprinted on the traditional ticket boarding pass slip, the home printed boarding pass or the boarding pass displayed in the mobile app provided by the airline. To be more precise the 2004 IATA Passenger Service Conference approved Resolution 792 setting the BCBP (Bar Coded Boarding Pass) standard as part of the STB (Simplify The Business) program.

The barcode simplifies passenger handling as the barcode can be read automatically by barcode readers along the passenger journey for bag-drop, security check area access and boarding. It significantly reduces the error rate to the time before barcode and eventually saved millions of Euros/Dollars due to mishandling and delays. Today we see self-boarding gates that remove the need for an agent, though business and first class passenger are still welcomed by a human gate agent. Btw, the magnetic stripe on the back of the old tickets expired in 2010.

Old Passenger Ticket without barcode (Image Public Domain)

The BCBP standard defines PDF417 (public domain standard, no fees or licenses) as the barcode symbol format as well defines the encoded content. The content in the barcode contains the same information as printed on the standard boarding pass, though some airlines omit information on the self-printed version in favor of simplicity, some extra info is optionally encoded.

2017-10-07 06_47_41-Boarding-Pass Barcode Aztec QR Generator

Sample PDF 417 barcode

M1SMITH/JOHN          EHJK345 FRASINLH 3456 280C015A0001 100

The standard covers 3 additional barcodes that are not used for printing, but used for mobile apps, these are Aztec and QR Code.

The encoding is straight foward using fix-length fields and the code can carry up to 4 legs of a journey.

Element Size Sample Remark
Format Code 1 M Always “M”
Number of legs encoded 1 1
Passenger Name 20
Electronic Ticket Indicator 2 E
Operating carrier PNR Code 7
Origin IATA Code 3 FRA Airport Code
Destination IATA Code 3 SIN Airport Code
Operating carrier IATA Code 3 LH Airline
Flight Number 5 3456
Date of Flight 3 280 Julian Date
Compartment Code 1 B First, Business, Economy
Seat Number 4 25A
Check-in Sequence Number 5 0012
Passenger Status 1 00

These are the mandatory fields, there are additional optional fields and blocks for baggage info, document info, frequent flyer number or security data.

To be noted, the IATA PADIS XML message standard shall be used for the exchange of BCBP data between systems, defined in Resolution 783 – Passenger and Airport Data Interchange Standards.

I like to add also, the printed barcode is the current common nominator for international travel, but there are initiatives on the way to simplify the passenger journey even further with newer technology such as biometric ID’s and identity management, eg. IATA OneIdentity Initiative.

In the next post we will assemble a simple Android application to read the boarding pass barcode. Stay tuned.

Disclaimer: The information provided here might not be correct or complete. It is for educational purpose only. For reliable information please refer to the IATA manuals.

Visualization Use Case Part 2: Airline Arrival Delays in the US (Tableau)

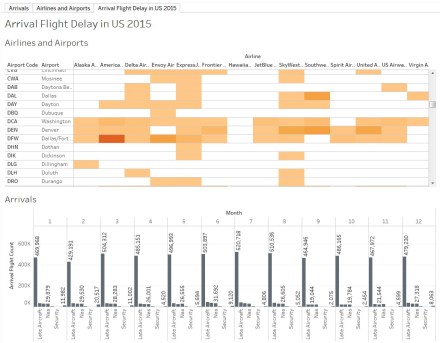
After reviewing the flaws of the previous visualization of the DOT Airline performance data in part 1, I created an improved version with the same recordsets. It is a separate viz because the first version have some mistakes due to the number conversion during the csv import. I cleaned up, checked the data and used calculated fields to derive the sum of delays.

Airline Performance in the US 2015

Airline Performance in the US 2015

The basic concept is still the same, the matrix on the top left controls the dashboard, initially you see all data for 2015 combined, clicking into cells drills down.
I changed the barchart to stacked bars comparing total to delayed flight in one bar for each month.

Bar Chart

Bar Chart

I moved the split delay reasons into a separate bar chart and added a pie chart which reveals the main reason for delays (surprisingly weather and security have the smalles share!) The 2 lists are a Top 10 style lists highlighting the airports and airlines with the most delays.

Performance

Airport Performance


Performance

Airline Performance


How does the visualization transport information ? Let’s look at the strong and weak points of the second iteration.

+ The key information presentation is improved. We can see the viz is about delays.

 The dashboard starts to look a bit disorganized and the viewer eyes are moving around without a centre of attention.

+ The barchart now makes sense, you can compare total flights and delays.

– The detail delay reason over time does not create too much value as the distribution of reason is quite similar.

Conclusion: Spending more time on both data and visualizations improved the overall impact, though a bit cluttered.

Lets try to apply to some more tweaking..

Visualization Use Case Part 1: Airline Arrival Delays in the US (Tableau)

Going beyond sample datasets and basic visualizations I was looking for open data in my professional domain, the aviation and airport industry. Potential candidates for visualizations are connections, routes, flight plans, airport and airline performance. Performance is usually the comparison of scheduled operations vs. actual milestones. The delay of arriving or departure flights is not only affecting passengers and many parties inside and outside the airport community, but it is driving sentiments, perception and reputation and eventually costs money. This kind of data is not something operators like to release but thanks to the Freedom of Information Act (FOIA), a US Federal law, public gets access to all kind of statistics. From the US DOT (Department of Transportation) you can access and download a variety of datasets, one of them is the On-Time Arrival Performance of US airlines in the US and their delay causes since the year 2003 (link). You can filter by airline, airport and timeframe, review the summary on the DOT website or download the set as CSV for your own analysis. I downloaded the complete dataset for 2015, a 2,25 MB file with roughly 13.500 records.

Arrival Delays in Tableau

Arrival Delays in Tableau


Airline Delays in the US in 2015 by DOT

Airline Delays in the US in 2015 by DOT


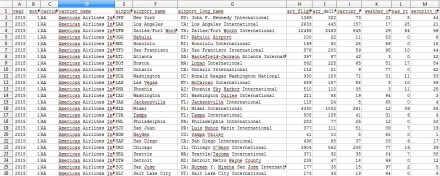
It provides total arriving flights, cancelled and diverted flights, the delay count and total time by reason (weather, carrier, NAS, security, late aircraft) for each month-airport-airline combination for 14 carriers at 322 airports.

Airline Delays in the US in 2015 by DOT

Continue reading

Airport AODB and Big Data

There are 4 technology terms that almost every IT company in any vertical business picked up during the last few years: Cloud, Big Data, Mobile and Internet of Things. In this series I review some of these buzz words in the Airport IT business context.

Today I will review the question: Does AODB data qualify for Big Data ?

What is Big Data ? A term that everyone uses, from consumer, consultants, user to people at CxO level. All have it, want it, need it, do it. Everyone joins the crowd, though few really know what it is and how to apply it in one’s own context or if one actually has a reasonable use-case for Big Data. I would not attempt to explain Big Data in this article, rather pick key elements and try to apply them. Big Data is too big to swallow and it comes in so many use cases, technologies, brands, products, flavours and attributes from Amazon, Google, Facebook to SAP Hana, No SQL, Mongo DB, Map Reduce, Hadoop and NSA. You can google for the term Big Data, read the Wikipedia Page about it or read one of the hundreds of books about, I can recommend a few here that I read.

9390823839_a02d5e07fd_z

Terra Ceia Island Farms gladiolus being loaded onto a U.S. Airlines plane at the Sarasota Airport (by State Library and Archives of Florida)

Do not expect an explicit yes or no answer in the end, though we will do a Big Data compliance check for every paradigm, but still I like to be open to find use cases.

The 3 (+3*) key words for that usually used to define Big Data:

  • Volume
    An enormous amount of data created by human interaction, machines and sensors
  • Velocity
    A massive and continuous flow of data from various sources, usually in real-time, but not limited to.
  • Variety
    Data from many sources in structured and unstructured form
  • Veracity*
    Noise and abnormality in data.
  • Validity*
    Correctness and accuracy of the data
  • Volatility*
    Data relevance. Lifespan of the data in which data shall be considered for any analysis.

(* Only the first 3 V’s – Volume, Velocity and Variety – are the canonical Big Data attributes, the additional V’s show up sometimes in discussion or papers, but they basically apply to all data.)

Some basic facts about an AODB product. An Aiport Operational Database is an enterprise application with a closed and rather predictable user-base. Depending on the size of the airport and the community serving it we might have up to 200 concurrent users and 1000 active accounts. It is not consumer facing, it is not social media, no click-streams and no input of sensors.

Volume

We need to build a data scenario in a typical or average AODB setup to discuss the term volume. I will try to create a typical scenario in order to create a total number of records or attributes over a typical time-span. Please consider this is as a simplified sample, the figures might vary a lot, depending on various factors, like country and region, international or regional, hub, primary airport, etc.
Usually the airport size in publications or comparisons is derived from the number of PAX and or movements of aircrafts per year.
For some references please refer to the ACI website.

A midsized airport around 20 to 30 million PAX a year might have around 500 turnarounds, this will be 1000 movements (arrival and departure).

Lets assume every movement have ..
20 milestones (scheduled, estimated, actual timings, A-CDM milestones or proprietary timings,..). Each of these milestones gets 3 updates (in average!)
10 load attributes (number of pax, total, by class, infants, cargo and weights,..). Each of these attributes gets 2 updates (in average!)
20 network messages (IATA Type B, AFTN, CFMU,..) This can vary extremely depending on the system landscape.
25 various attributes (flight number, registration, tailnumber, flightplan ID, aircraft type, callsign, resources, connecting flights,..) Each of these attributes gets 2 updates (in average!)
This results in 150 attributes (inclusive of updates) per movement. Applied to 1.000 movements day, we will have
150.000 attributes per day,
4.500.000 attributes per month
27.000.000 attributes per season (6 months, one seasonal schedule)

This approach is conservative, it does not cover audit or system logging. It does not consider a situation where the AODB serves as central data repository (warehouse?), with data-feeds from other systems for permanent storage. In more complex environments I saw requirements to process and store 10.000.000 ground radar updates or 1.000.000 updates from the Building Management system a day.

Do 27 million attributes in 6 months qualify for big data volume ?
In this case I would say no, but taking into the account the option to store more than one season of data and maybe to cover more than one location in a multi-airport situation, maybe yes !

Velocity

Do 150.000 attributes a day qualify for big data velocity ?
Braking down to an average of 1,7 updates a second, rather not. It does not require an Big Data architecture to process this.
Compare with Twitter (not a fair comparison though): ~10.000 tweets a second.

Variety

First, we have almost no unstructured data. Once the AODB has been put in place and production there are hardly changes in the structure of the data. Unstructured data might come with free format messages or partial free format content.
The variety also depends on the complexity of the IT landscape and the number of interfaces, AODB’s often play the role of central system integration and we face lot of inbound data streams, but they usually come in an agreed format.


Thoughts on Big Data Analysis

One of the selling points of Big Data is the analytic you can apply to the vast amount of data to identify patterns, extract useful knowledge and business value from the data collected. This might help to improve your business strategies or processes or focus on certain areas of value, even predict future scenarios given certain repeating conditions. We can see definitely value added to the AODB context here, though lot of the data is given and can be adjusted only with limitations or not at all, eg. flight schedules provided by airlines (usually result from slot coordination procedures) and the airport physical resources (stands, gates, belts,..). The potential lies in the analytic of actual data, even the airport can’t necessary change schedules, but with patterns emerging from actual data vs. scheduled data (eg. delays in dependency of certain weather, season, etc.), we can optimize the resources. Analysing connecting flight info can help to improve turnaround ground times and avoid delays, detecting frequent aircraft changes can help to improve gate allocation an other scenarios.
And looking at the big picture, if we would be able to collect from a network or countrywide or on a level like Eurocontrol, Big Data analysis certainly will create more valuable insights and improve on-time performance.

Big Data Bookshelf

Big Data: Principles and Best Practices of Scalable Realtime Data Systems

Big Data For Dummies

Ethics of Big Data: Balancing Risk and Innovation

Data Science for Business: What you need to know about data mining and data-analytic thinking

Some assorted links

Airport AODB in the Cloud and Big Data

Working for more than 15 years with IT systems in airport operations I pretty much experienced most areas from development, testing, system integration, documentation, training and project management. I spend many years on and with a classic client-server based system, partially with legacy technology, and designed and built an AODB from the scratch in new technology and deployed it to the cloud. Two topics drew my attention particularly in the last few years, the “AODB in the Cloud” and “AODB and Big Data”, I like to review them in some short articles here. This talk is politics-free and does not refer to specific products or companies.

For the reader without airport operational background my elevator speech description for AODB. (Did you notice ? there is no entry in Wikipedia for AODB.)

AODB – Aiport Operational Database
An AODB system is usually the core IT system to support the airport ground operations, it integrates with various systems from the heterogeneous IT landscape found at the airport, compiling data from airlines flights schedules, flight plan management, communication between airlines and airports to building management systems, live ground movements and many more systems.
It serves as platform for CDM (Collaborative Decision Making) for the various parties forming the airport community, from airport operators, airlines, groundhandling agents to ATC (Air Traffic Control).
It handles seasonal and operational flights by providing both real-time and historical data, supports resource management for facilities and equipment, as well for staff, it is an information portal.

The AODB itself can be reduced to a simple 3-tier piece architecture, a database, business logic processing layer and a frontend.
It can be complemented by ESB (Enterprise Service Bus), BI (Business Intelligence) and other components.

Unlike consumer (software) products, this is rather a niche market, and AODB systems are offered only by a couple of companies. To name a few (in alphabetical order):
Amadeus, Arinc, T-Systems, IBS, Inform, Intersystems, ISO, Ultra,.. I leave it to the reader to find out more about these companies and their products.

The U.S. National Archives At Portland International Airport 05/1973

I like to discuss in the next few blog entries the following topics triggered by the technical and operational evolution AODB systems are going through.

Image: At Portland International Airport 05/1973 by The U.S. National Archives (cc)

Online IATA Telex Processor

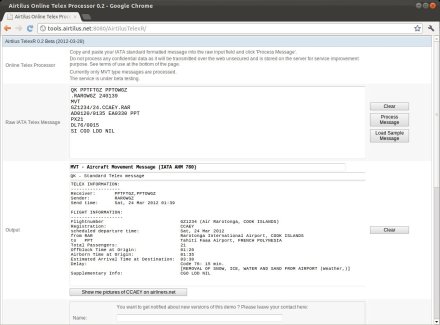
I launched a first version of a Telex processor with a web frontend. It is a beta version and currently only processes MVT standard messages.

Some words about the requirements for a flexible interface processor

  • Though IATA Telexes are defined by a standard, variations are common because some are produced automatically by other systems and some are created manually, which causes more errors. The processing of telexes, the pattern recognition, must be flexible enough to be able to handle extra inline whitespaces and dots, as well extra lines with free text or extra headers and trailer, eg. now it is more common to receive telexes via email and often some extra email information is added as header before it reaches your system. Customers also might create their own telex standards, meaning the whole message is transported as free text message, but inside the message the customer uses his own syntax for data transmission.
    This requires a message interpreter that can be configured for new or non-standard formats on the fly, without the need to change any sourcecode and to redeploy a system.
    (I saw a project at one airport where the change of LDM format interpretation would have cost the customer around 10.000 Euro because one of the cargo airlines send messages with an extra header line)
  • Other standard messages, such as AFTN, NOTAM or CFMU should be processed by the same engine using the same approach. One interface engine with the flexibility of the scripts covers the various aspects of the different types.

A few words about concept and architecture

  • ESB
    Certainly the word ESB sometimes might appear bloated like other IT buzzwords, but it hardly makes sense today to implement distinct own interface systems for every protocol or subsystem type you come across. In a heterogeneous IT landscape like an airport an ESB allows you to easily connect inbound and outbound to a number of other systems via TCPIP, Email, FTP,.. or even talk to other standard systems like SAP, Salesforce.com and so on. We use one connector to talk to the ESB, the rest we orchestrate in the ESB itself. With MULE ESB we have the freedom of an opensource product as well the power of enterprise support. The learning curve for MULE is not too steep.
    For the sample of telexes: Sometimes you ‘receive’ telexes by using the auto export function of the Sitatex application and retrieve the files with the messages via FTP, or you receive the messages as email or via a queuing server from a central corporate entrypoint. We can swing over to another source or run in parallel without touching the main system.
  • Script Engine
    Instead of hardcoding the various formats, we use a Java Script engine executing Groovy Scripts. These scripts, one for each message type, are stored in the DB and can be adjusted or customized easily. The scripts produce an internal XML formatted standard output which easily can be un-marshalled during the downstream processing using proper XSD.
  • Data Processing
    Whatever requirements you have how to handle the received data. In our sample system here, receive from the web frontend and make it human readable.

Please feel free to drop by http://xxxxx (currently not available, apologies) and try by yourself. Please note: Do not process confidential as the data is transmitted unsecured and might be stored (to improve the quality). This is NOT a commercial offering but a technology showcase. There is no warranty that the server is available or the processor correct. You can use the example message and modify it, otherwise copy and paste your own message.

The service is currently running on a Amazon EC2 micro instance, performance might decrease with a lot of traffic.

Online Telex Processor

Outlook

  • Summary for errors and rejected messages.
  • For the next versions I will add some of the other available telex types will follow such as LDM and CPM.
  • Add AFTN message interpretation.
  • Email Reply (send an email to the service and the human readable version is emailed back to the user).